Overview
MedModr (Mediation & Moderation) is a free, browser-based statistical tool for conducting simple mediation, serial mediation, moderation, and moderated mediation (conditional process) analyses.
All data processing occurs client-side. No data is sent to any server. You can disconnect from the internet after the page loads and still run complete analyses.
Methodological Framework
MedModr follows the regression-based approach detailed in Hayes (2022) Introduction to Mediation, Moderation, and Conditional Process Analysis. The tool implements Ordinary Least Squares (OLS) regression via matrix algebra, providing both unstandardized (b) and standardized (β) coefficients, bootstrap confidence intervals for indirect effects, and interactive visualizations.
Features & Capabilities
X → M → Y with full path coefficients, Sobel test, bootstrap CIs, and interactive path diagram.
X → M1 → M2 → Y with specific indirect paths, total indirect effects, and bootstrapped CIs.
X × W → Y with simple slopes at ±1 SD and mean, annotated slopes plot.
Conditional indirect effects, index of moderated mediation (IMM), bootstrap CIs.
Percentile bootstrap confidence intervals for all indirect effects (1,000–10,000 samples).
Path diagrams with toggle for unstandardized/standardized coefficients, p-values, black/white mode.
APA-formatted summaries, Word document export, copy-to-clipboard functionality.
Unlimited covariates automatically mean-centered in all regression models.
Quick Start Guide
Each variable as one numeric value per line (no header row). All variables must have the same number of rows (N). For multiple variables, enter each variable's data in separate columns (space or comma separated).
4.8 2.1 3.5
3.2 4.5 2.8
5.1 1.9 4.3
3.9 3.8 5.2
Choose from Simple Mediation, Serial Mediation, Moderation, or Moderated Mediation.
Provide meaningful names (e.g., "Stress", "Coping", "Wellbeing") and paste your numeric data.
First line = variable names (space separated), subsequent lines = numeric values.
Choose confidence level (90%, 95%, 99%), bootstrap samples (None [Sobel only], 1000, 5000, 10000), centering options for moderation models.
Review regression tables, path diagrams, simple slopes plots, and APA-formatted summaries. Export to Word or copy results.
Simple Mediation (X → M → Y)
In MedModr, click the Simple Mediation tab (X → M → Y).
Provide names and data for independent X, mediator M, and outcome Y. All three variables must have the same number of rows.
Enter control variables in the Covariates box: first line = names (space separated), subsequent lines = numeric values.
Choose confidence level (90%, 95%, 99%), bootstrap samples (0, 1000, 5000 or 10000). Click Run Analysis
The output includes: a‑path (X→M), b‑path (M→Y), total effect, direct effect, indirect effect (a×b), Sobel test, bootstrap CI, and interactive path diagram.
Mathematical Formulas
b-path (M → Y): Y = i₂ + c'·X + b·M + e₂
Total effect (c): Y = i₃ + c·X + e₃
Sobel Standard Error: SE = √(b²·SEₐ² + a²·SE_b²)
Sobel z-test: z = IE / SE
p-value: p = 2 × [1 - Φ(|z|)]
1. Draw B samples with replacement (size n)
2. For each sample b, compute θ̂ᵦ = aᵦ × bᵦ
3. Sort θ̂(1), θ̂(2), ..., θ̂(B)
4. 95% CI = [θ̂(₀.₀₂₅×B), θ̂(₀.₉₇₅×B)]
Serial Mediation (X → M1 → M2 → Y)
Click the Serial Mediation button (X→M1→M2→Y).
Provide names and data for independent X, first mediator M1, second mediator M2, and outcome Y. All four variables must have the same number of rows.
Enter control variables in the Covariates box: first line = names (space separated), subsequent lines = numeric values.
Choose confidence level (90%, 95%, 99%), bootstrap samples (0, 1000, 5000 or 10000). Click Run Analysis
Results include three specific indirect effects: X→M1→M2→Y (serial), X→M1→Y, X→M2→Y, plus total indirect, direct effect, and bootstrap CIs.
Mathematical Formulas
M2 model: M2 = i₂ + a₂·X + d₂₁·M1 + e₂
Y model: Y = i₃ + c'·X + b₁·M1 + b₂·M2 + e₃
IE₁ (via M1 only) = a₁ × b₁
IE₂ (via M2 only) = a₂ × b₂
IE₃ (serial M1→M2) = a₁ × d₂₁ × b₂
Total Indirect Effect: IEₜₒₜₐₗ = IE₁ + IE₂ + IE₃
If the bootstrap confidence interval does not contain zero, the indirect effect is statistically significant at α = 0.05 (two-tailed). Mediation is supported when the indirect effect is significant, regardless of whether the total effect (c) or direct effect (c') is significant (Hayes, 2022).
Hayes (2009) recommends at least 5,000 bootstrap samples for stable confidence intervals of indirect effects. MedModr offers up to 10,000 bootstrap samples.
Reference: Hayes, A. F. (2009). Beyond Baron and Kenny: Statistical Mediation Analysis in the New Millennium. Communication Monographs, 76, 408-420.
Moderation (X × W → Y)
Click Moderation (X × W → Y).
Provide variable names and numeric data for independent X, moderator W, and outcome Y. All three variables must have the same number of rows.
Options: Mean Centering (All variables), Mean Centering (Only continuous variables), or No Mean Centering.
The table shows b₃ (X×W) coefficient with p‑value. If significant, moderation is present. Simple slopes at low (−1 SD), mean, and high (+1 SD) levels of W are displayed together with an annotated slopes plot.
Mathematical Formulas
Low (-1 SD): θ = b₁ + b₃ × (W̄ - SD_w)
Mean (0 centered): θ = b₁ + b₃ × W̄
High (+1 SD): θ = b₁ + b₃ × (W̄ + SD_w)
Simple Slope SE: SE(θ) = √[Var(b₁) + W²·Var(b₃) + 2W·Cov(b₁,b₃)]
Mean-Centering Options
- All variables centered: (X - X̄) × (W - W̄)
- Continuous-only centered: Center continuous X and W, leave binary (0/1) variables raw
- No centering: Raw X × Raw W
Moderated Mediation (Conditional Process)
Click Moderated Mediation tab (X → M → Y, with W moderating the a‑path).
Provide variable names and numeric data for independent X, mediator M, moderator W, and outcome Y. All four variables must have the same number of rows.
Options: Mean Centering (All variables), Mean Centering (Only continuous variables), or No Mean Centering.
Output includes: simple slopes of X→M at three levels of W, conditional indirect effects (a·b) at each level, analytic and bootstrap CIs, and the index of moderated mediation (a₃·b)
Mathematical Formulas
Stage 2 (b-path): Y = i₂ + c'·X + b·M + e₂
Conditional Indirect Effect at level w of W: IE(w) = (a₁ + a₃·w) × b
Index of Moderated Mediation (IMM): IMM = a₃ × b
IE(Mean) = a₁ × b
IE(Low) = (a₁ - a₃·SD_w) × b
IE(High) = (a₁ + a₃·SD_w) × b
The Index of Moderated Mediation (IMM = a₃ × b) quantifies the linear change in the indirect effect as a function of the moderator W. A bootstrap confidence interval that excludes zero indicates statistically significant moderated mediation (Hayes, 2015).
Reference: Hayes, A. F. (2015). An Index and Test of Linear Moderated Mediation. Multivariate Behavioral Research, 50(1), 1-22.
OLS Regression (Matrix Algebra)
All regressions in MedModr are computed using Ordinary Least Squares (OLS) via matrix algebra, the same method used in major statistical software packages.
Standardized Coefficients (β)
Every regression table includes both unstandardized b and standardized β. Standardized coefficients are obtained by re‑running the same regression on z‑scored variables (mean = 0, SD = 1).
Then: β = (Zₓ'Zₓ)⁻¹Zₓ'z_y
A one standard deviation change in X produces a β standard deviation change in Y. Standardized coefficients allow direct comparison of effect sizes across predictors measured in different units.
Bootstrap Confidence Intervals
For all indirect effects (simple, serial, conditional, index), MedModr implements the percentile bootstrap method. User‑selectable resamples: 1000, 5000, or 10000.
Step 2: For each bootstrap sample b, compute the statistic of interest θ̂ᵦ (e.g., a×b, a₃×b).
Step 3: Sort all B estimates: θ̂(1), θ̂(2), ..., θ̂(B).
Step 4: For 95% CI: lower bound = θ̂(₀.₀₂₅×B), upper bound = θ̂(₀.₉₇₅×B).
If the bootstrap confidence interval (e.g., 95% BootLLCI to BootULCI) does not contain zero, the indirect effect is statistically significant at α = 0.05 (two‑tailed). This method does not assume normality of the sampling distribution — a critical advantage for indirect effects which are often non-normal.
p-value Calculation
MedModr computes exact two-tailed p-values using the cumulative distribution function (CDF) of the t-distribution:
P(T > t) = 1 - Iₓ(df/2, 1/2) with x = df/(df + t²) and I = regularized incomplete beta function
For indirect effects (when bootstrap is not used), p-values come from the Sobel z-test assuming normality:
Covariate (Control Variable) Handling
All specified covariates C₁, C₂, ..., Cₖ are automatically mean-centered and included in every regression model:
b-path model: Y = i₂ + c'·X + b·M + Σδⱼ·Cⱼ + e₂
Total effect model: Y = i₃ + c·X + Σθⱼ·Cⱼ + e₃
Covariates are mean-centered (Cⱼ - C̄ⱼ) to improve interpretability of the intercept and reduce multicollinearity with interaction terms.
age education_level
25 2
30 3
28 2
45 4
32 3
Path Diagrams
Simple Mediation (X → M → Y)
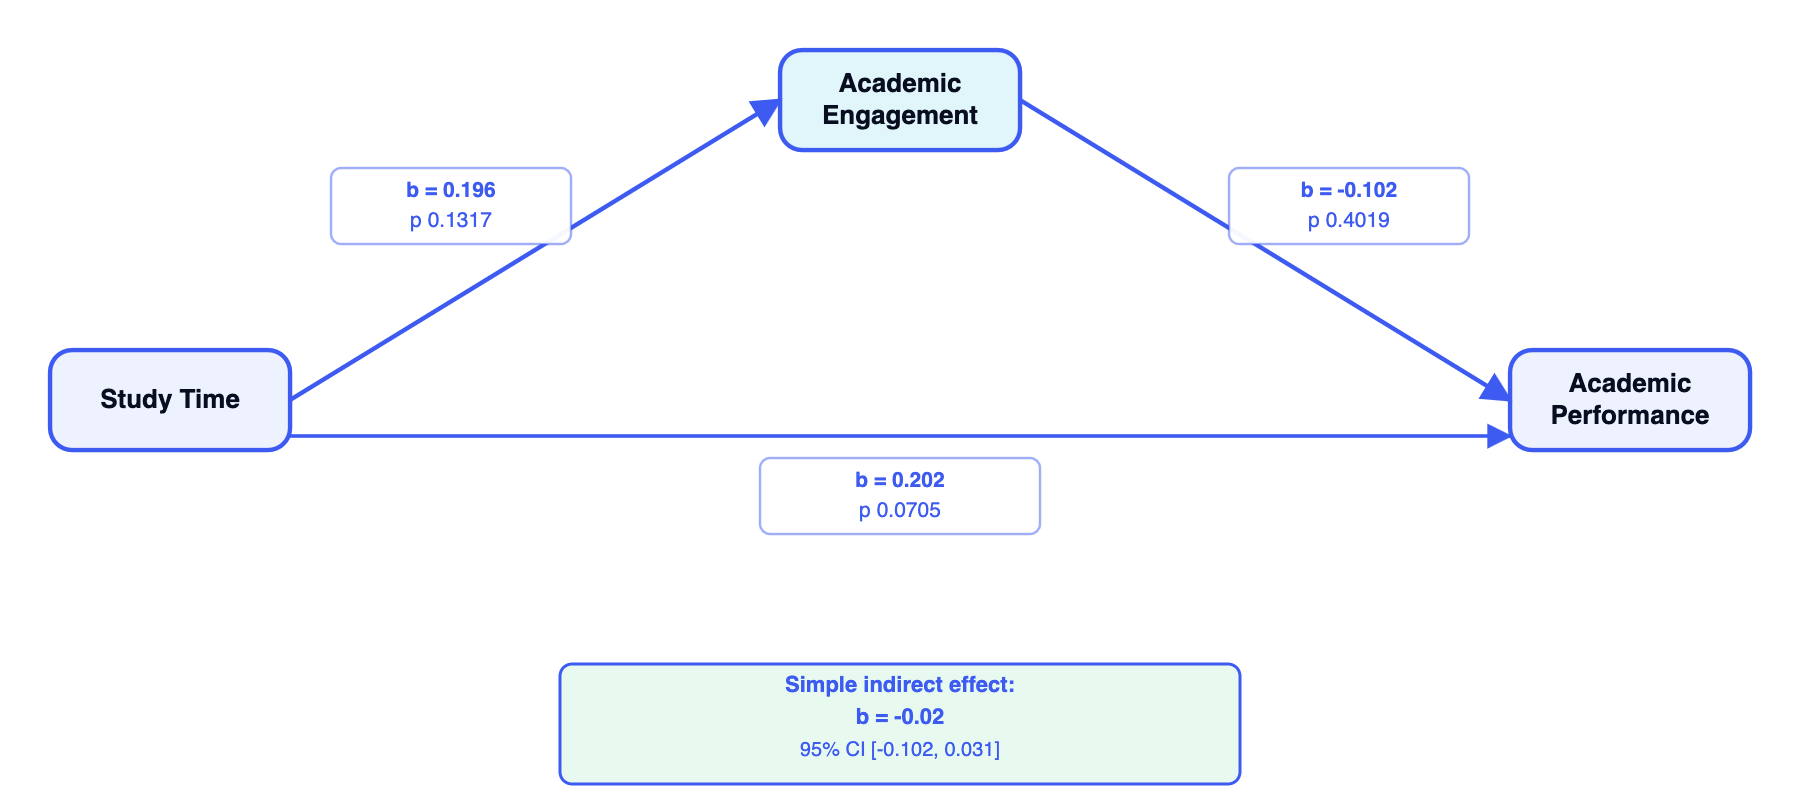
🔍 Click image to view full size
Serial Mediation (X → M1 → M2 → Y)
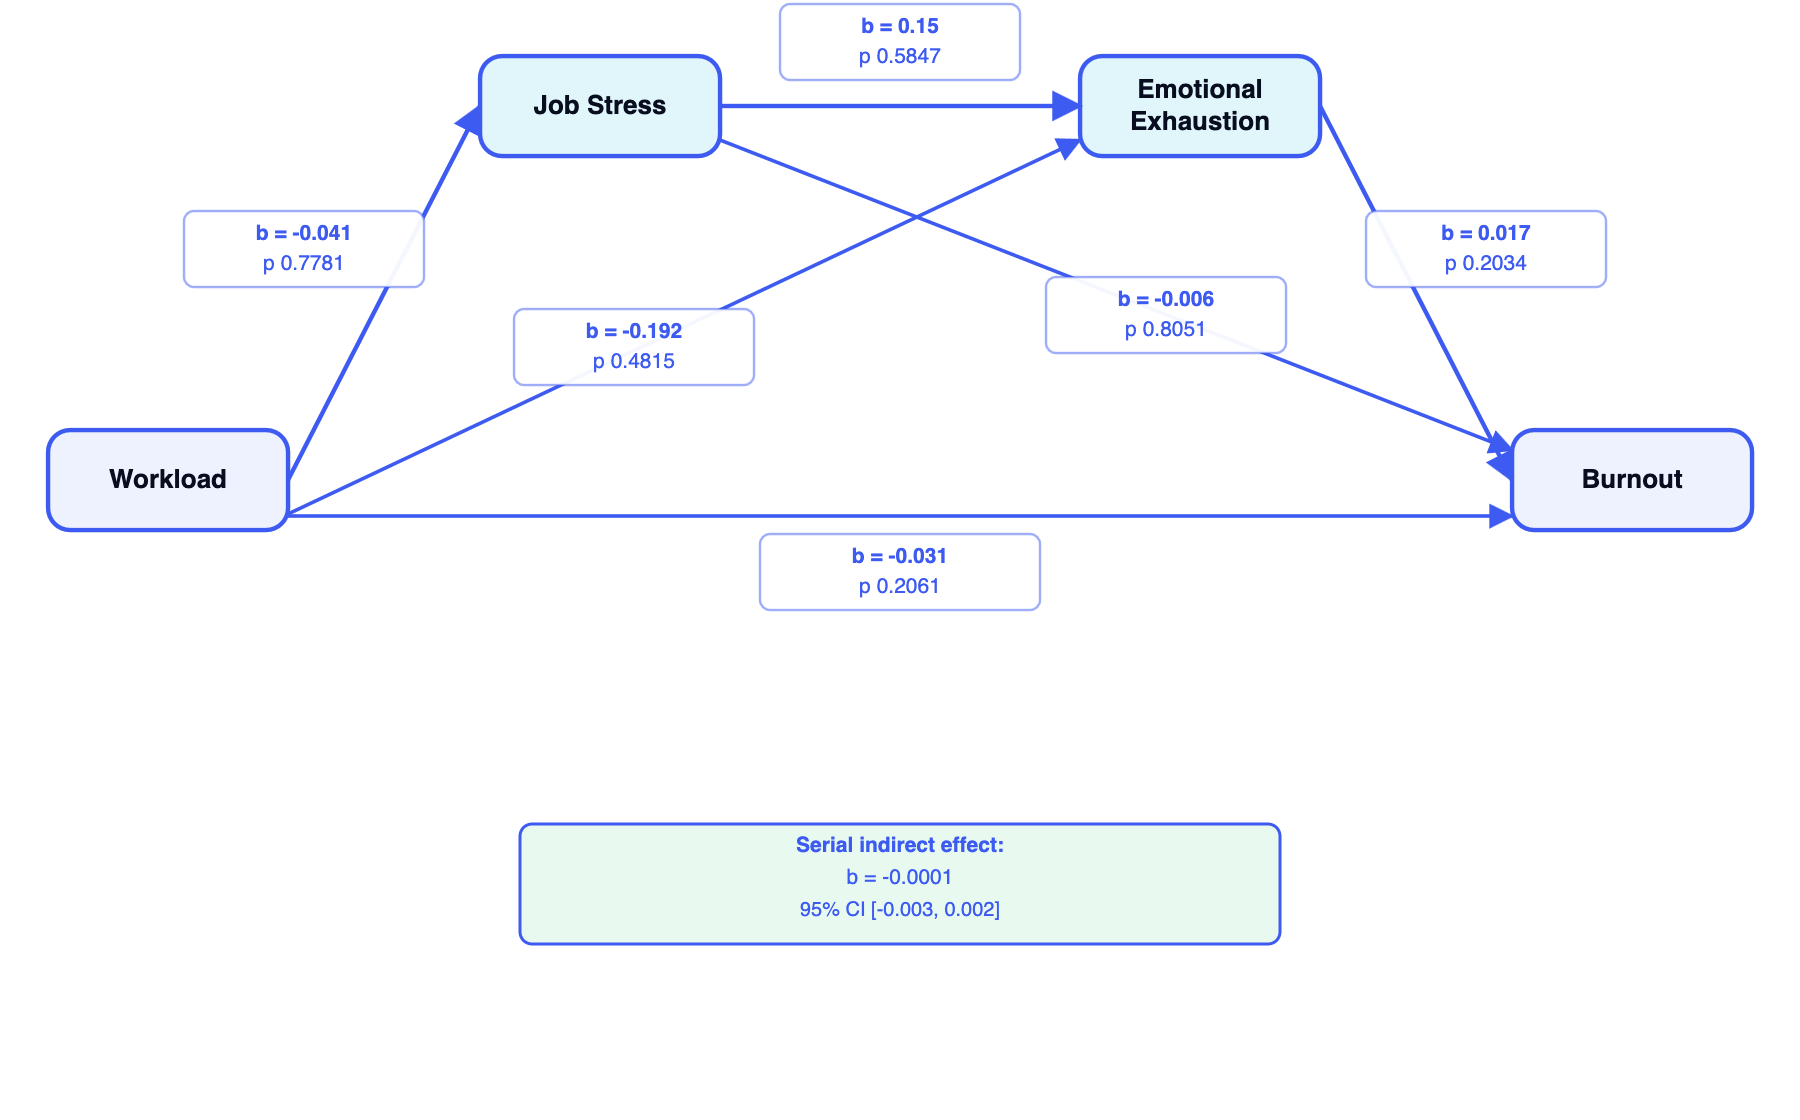
🔍 Click image to view full size
Moderation (X × W → Y)
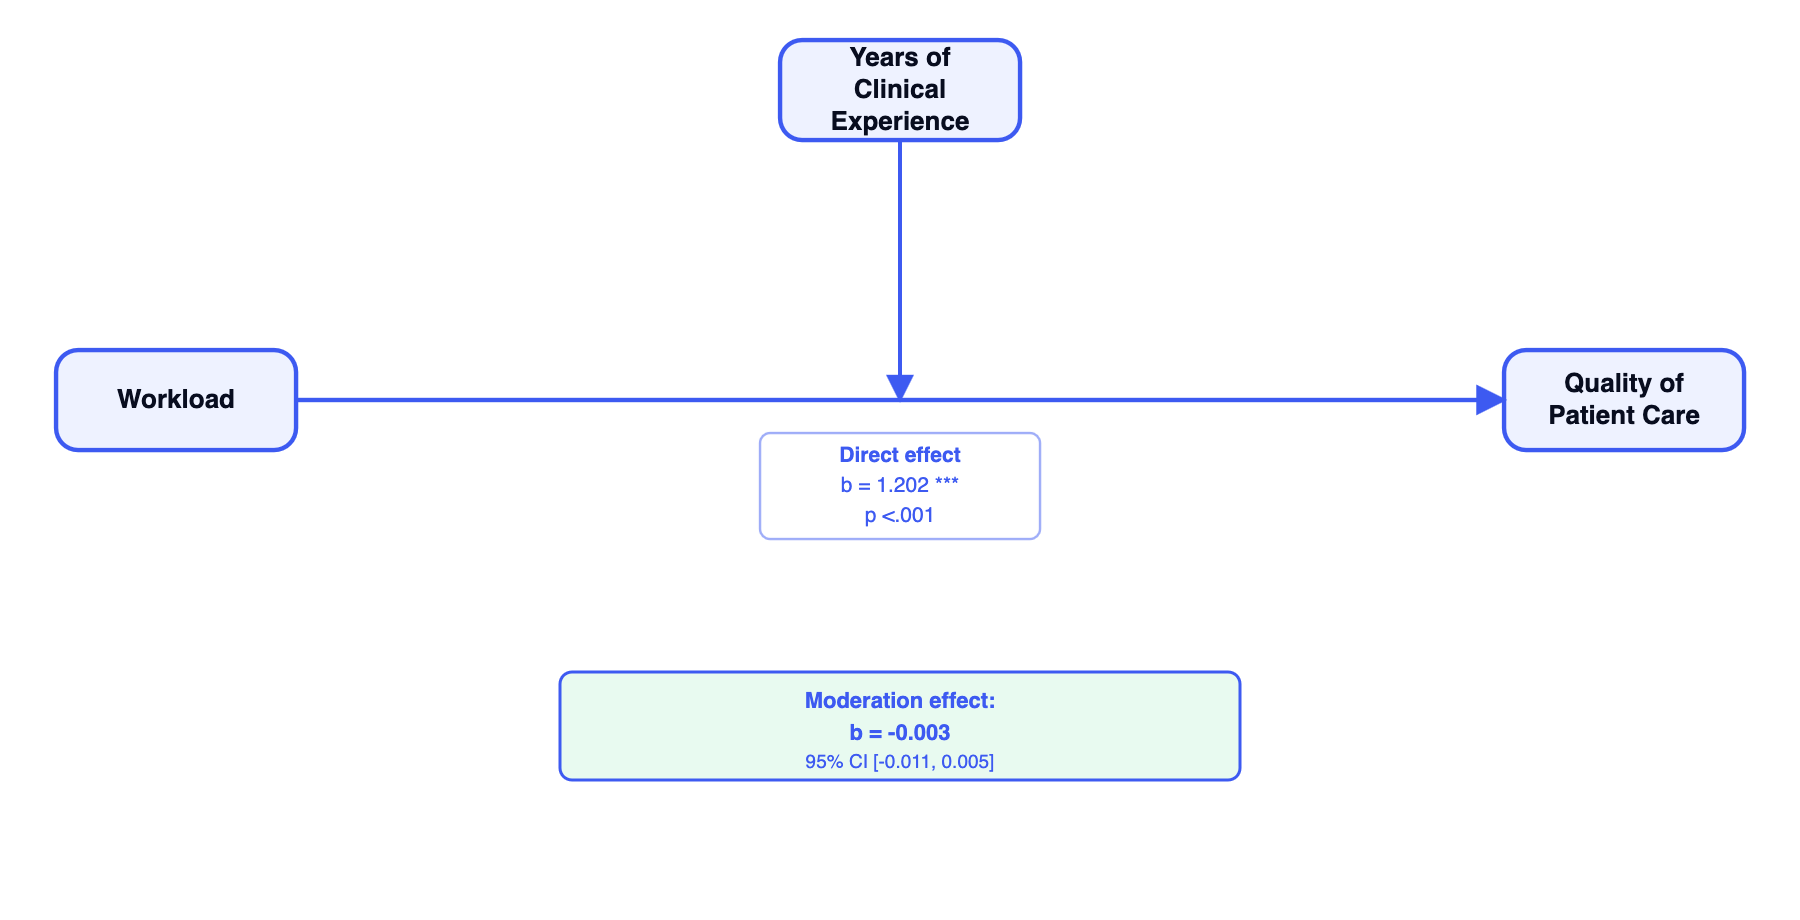
🔍 Click image to view full size
Moderated Mediation (Conditional Process)
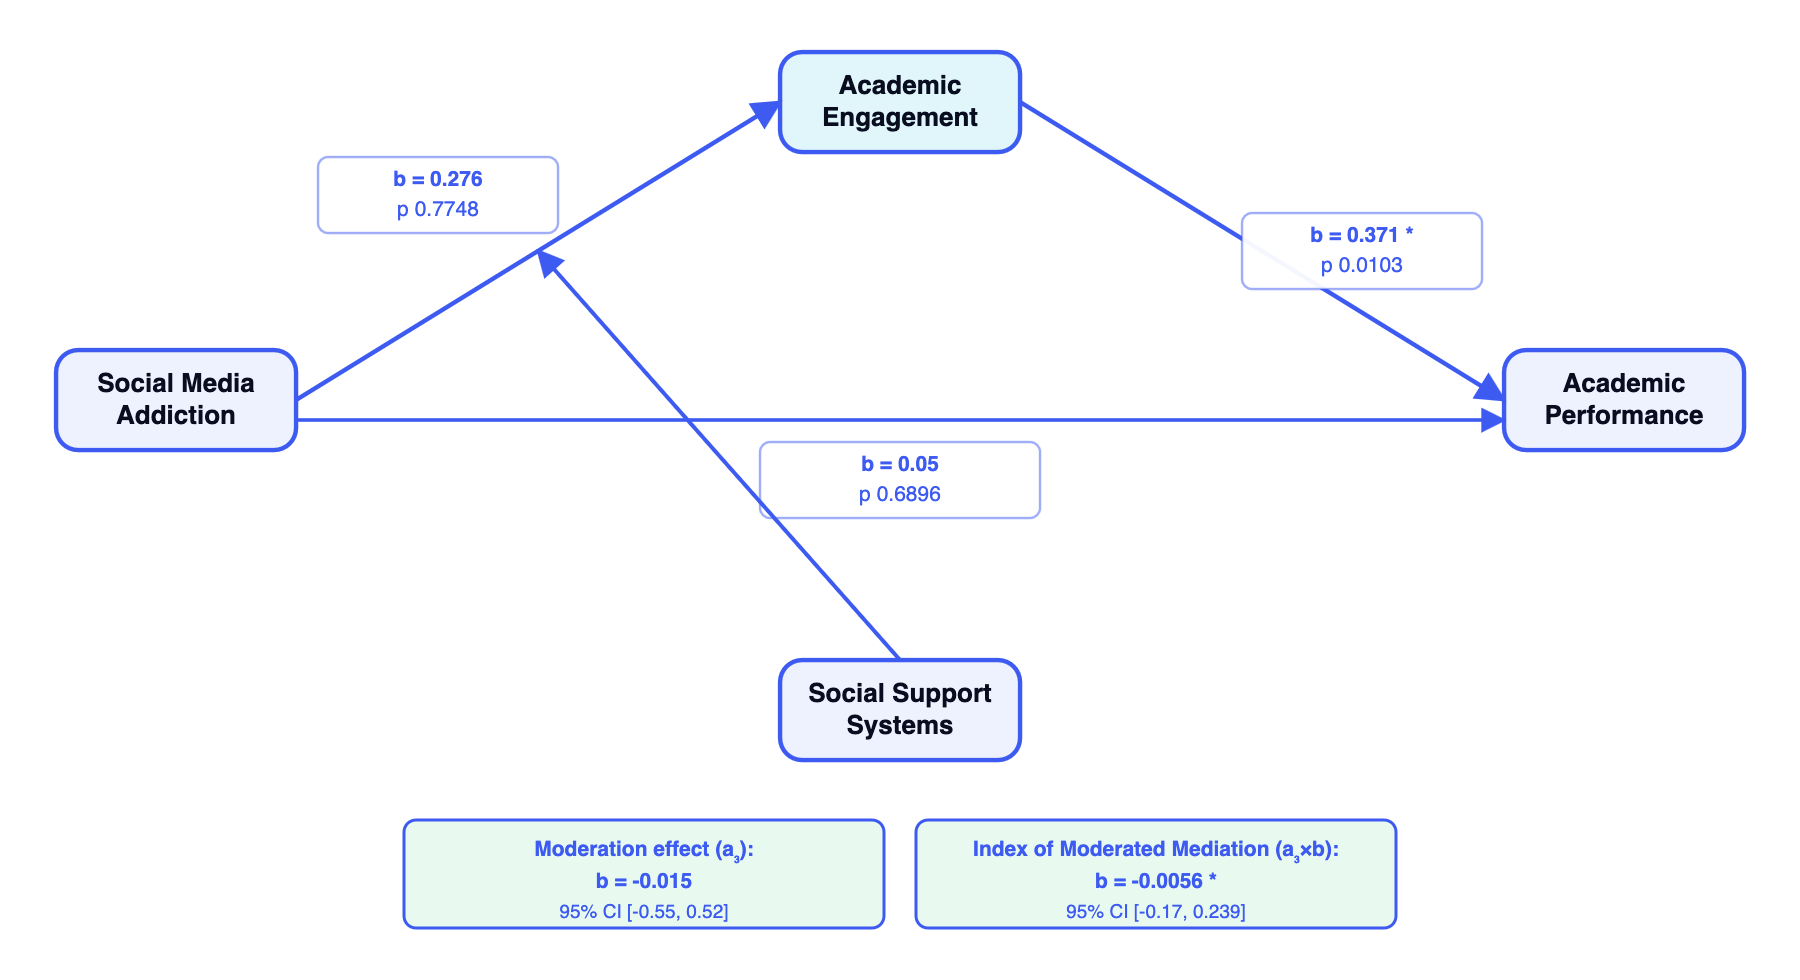
🔍 Click image to view full size
Click "View full‑screen diagram" to open a modal. Toggle between unstandardized/standardized coefficients, hide/show p‑values, toggle black/white mode, download as PNG.
• Unstandardized (b) or Standardized (β) coefficients
• Show/Hide p-values
• Black & White mode for publication
• Dotted or solid direct effect line
• Download high-resolution PNG
All path diagrams automatically wrap long variable names to prevent text overflow. The black & white mode creates publication-ready diagrams suitable for manuscripts.
Simple Slopes Plots
The Simple Slopes Plot is available for Moderation and Moderated Mediation analyses, showing the effect of X on Y (or X on M) at three levels of the moderator W: Low (−1 SD), Mean, and High (+1 SD).
Simple Slopes Plot
For Moderation & Moderated Mediation Analysis
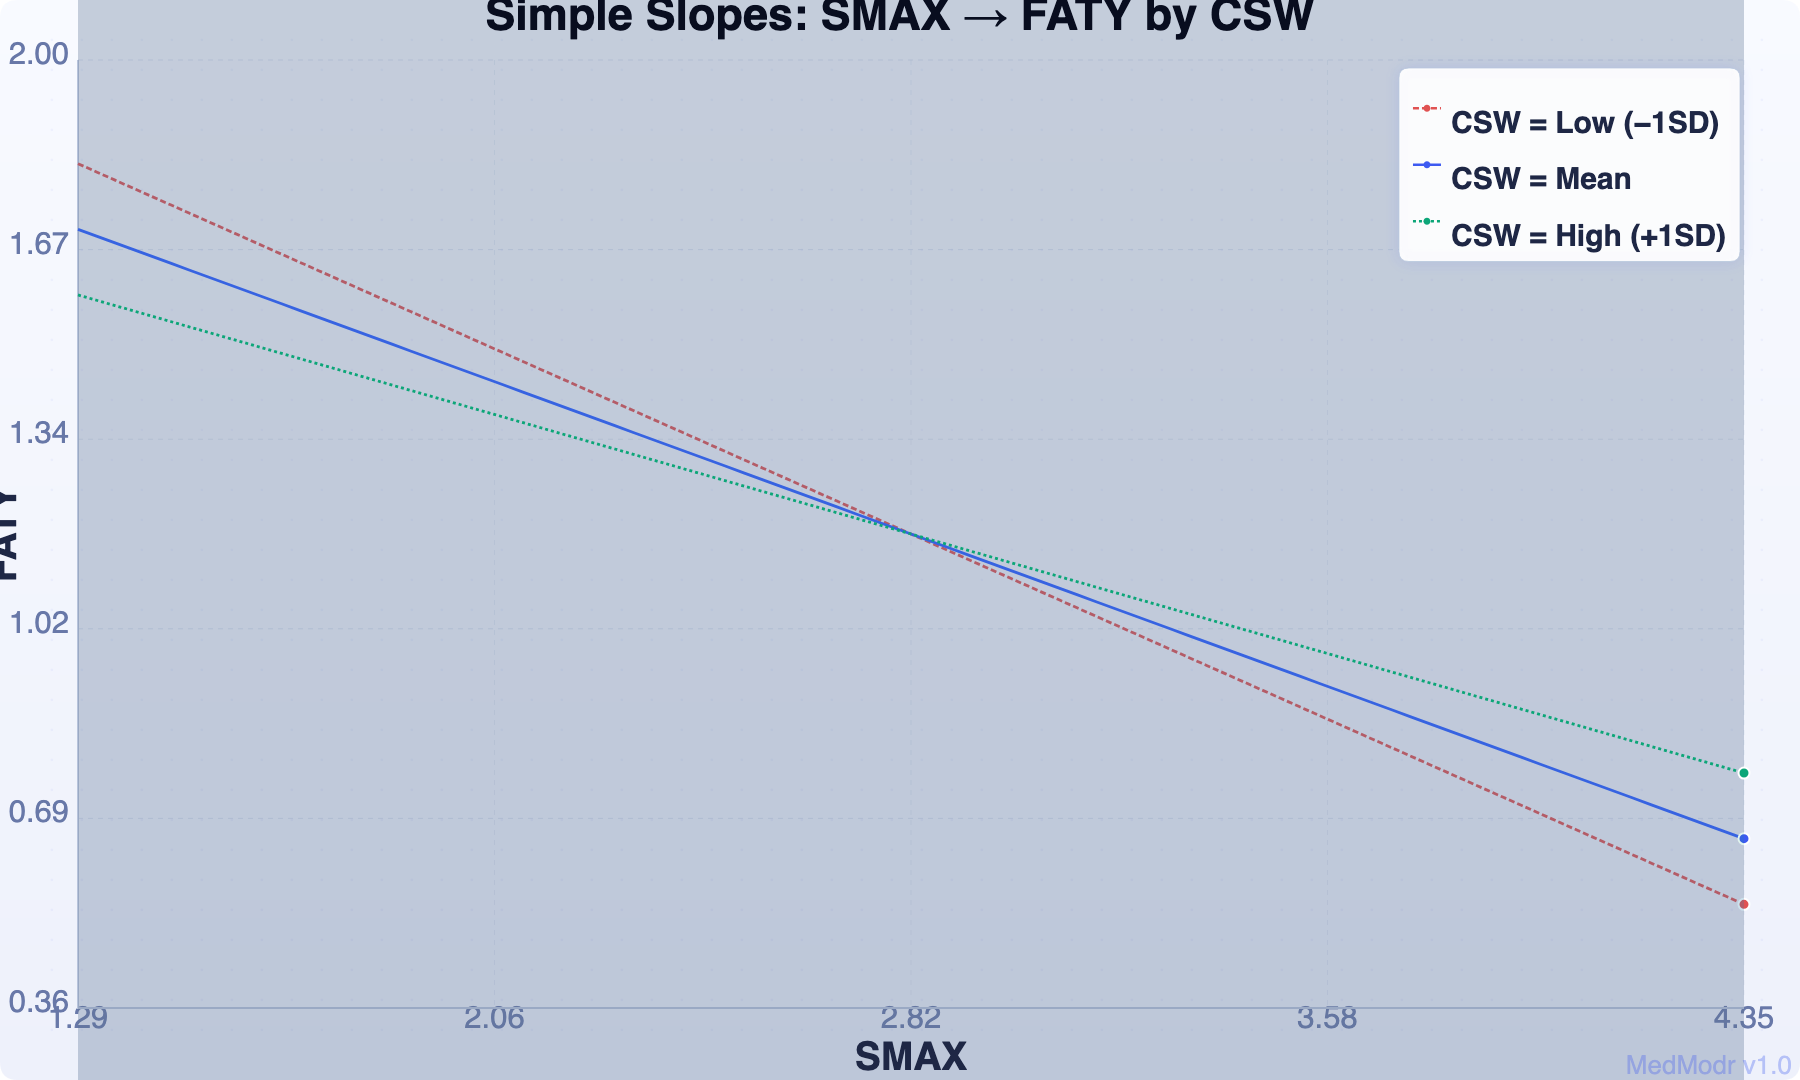
🔍 Click image to view full size and toggle between versions
The simple slopes plot displays separate regression lines for X predicting Y at three conditional values of the moderator W. Toggle between the standard version (no p-values) and the annotated version (with p-values shown on each slope line) using the buttons above the plot or inside the full-screen viewer.
License & Permissions
Copyright (c) 2026 Mudasir Mohammed Ibrahim
Permission is hereby granted, free of charge, to any person obtaining a copy of this software and associated documentation files (the "Software"), to deal in the Software without restriction, including without limitation the rights to use, copy, modify, merge, publish, distribute, sublicense, and/or sell copies of the Software, and to permit persons to whom the Software is furnished to do so, subject to the following conditions:
The above copyright notice and this permission notice shall be included in all copies or substantial portions of the Software.
THE SOFTWARE IS PROVIDED "AS IS", WITHOUT WARRANTY OF ANY KIND, EXPRESS OR IMPLIED, INCLUDING BUT NOT LIMITED TO THE WARRANTIES OF MERCHANTABILITY, FITNESS FOR A PARTICULAR PURPOSE AND NONINFRINGEMENT. IN NO EVENT SHALL THE AUTHORS OR COPYRIGHT HOLDERS BE LIABLE FOR ANY CLAIM, DAMAGES OR OTHER LIABILITY, WHETHER IN AN ACTION OF CONTRACT, TORT OR OTHERWISE, ARISING FROM, OUT OF OR IN CONNECTION WITH THE SOFTWARE OR THE USE OR OTHER DEALINGS IN THE SOFTWARE.
1. You can download and use MedModr for free, including for commercial purposes.
2. You can modify the source code and create your own versions.
3. You can host MedModr on your own institutional domains or servers.
4. You can include MedModr in your research or teaching materials.
5. You must retain the copyright notice and license in any distributed copies.
️6. The software is provided "as is", without warranty of any kind.
How to Contribute
MedModr is open source and welcomes contributions from the community! Whether you want to fix a bug, add a feature, improve documentation, or translate the interface, your help is appreciated.
Contribution Workflow
- Fork the repository on GitHub: https://github.com/shinyhealthtools/medmodr
- Clone your fork locally:
git clone https://github.com/YOUR_USERNAME/medmodr.git - Create a new branch for your feature:
git checkout -b feature/your-feature-name - Make your changes and test them thoroughly
- Commit your changes with a clear message:
git commit -m "Add: description of your change" - Push to your fork:
git push origin feature/your-feature-name - Submit a Pull Request on GitHub describing your changes
• Report bugs or suggest features by opening an issue on GitHub
• Improve documentation or add examples
• Add new analysis types or visualization options
• Optimize performance for large datasets
• Translate the interface to other languages
• Fix existing bugs or issues
Data Input Format
All data entry is text‑based: one numeric value per line, no header row. Example:
3.4
5.1
2.8
4.2
3.7
4.5
2.1
All variables must have the exact same number of rows (N). Covariates are optional: first line = variable names (space or comma separated), subsequent lines = numeric data.
Binary Variables (Dummy Coding)
Manual dummy coding required. MedModr does not automatically convert categorical variables (e.g., gender, treatment group, education level) into dummy codes. All categorical predictors including moderators and covariates must be converted by the user into numeric 0/1 dummy variables before pasting data into the tool. For a categorical variable with k levels, create k−1 dummy variables. The reference group should be coded as 0 on all dummies. Continuous variables can be used as-is and will be automatically mean-centered when appropriate.
Limitations
Citation
References
- Hayes, A. F. (2022). Introduction to Mediation, Moderation, and Conditional Process Analysis: A Regression-Based Approach (Vol. 3). The Guilford Press.
- Hayes, A. F. (2015). An Index and Test of Linear Moderated Mediation. Multivariate Behavioral Research, 50(1), 1-22.
- Hayes, A. F. (2009). Beyond Baron and Kenny: Statistical Mediation Analysis in the New Millennium. Communication Monographs, 76, 408-420.
Developer Information
Contact & Support
For bug reports, feature requests, or general inquiries, please email:
mudassiribrahim30@gmail.com
You can also open an issue on GitHub: github.com/shinyhealthtools/medmodr/issues